Address
8-9 Marino Mart, Fairview, Dublin 3, D03 EK81, Ireland
Contact
[email protected]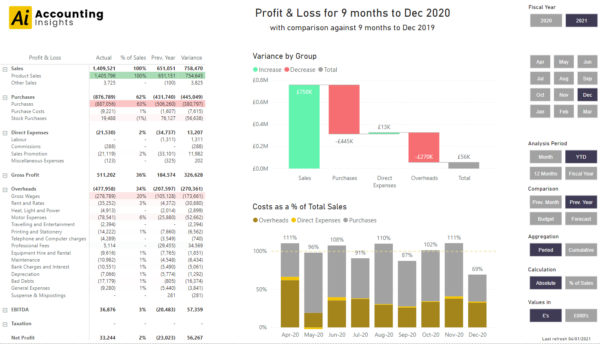
£49.00
The Accounting Insights Profit and Loss template is a powerful four-page profit and loss template showing actual and variance against previous, budget and forecast amounts. This Power BI Profit and Loss Template is provided in generic form (with Excel as a data source).
Power BI Profit and Loss Template – Sage 50 Accounts example
The Power BI Profit and Loss Template from Accounting Insights is intended for accountants and Power BI professionals that want to produce profit and loss reports using Power BI.
The template provides a fully working report with sample data. The template enables you to compare actual against previous, budget or forecast and drill through to transaction details. It also enables you to present all lines as a % of total sales.
With full access to the .pbix file and sample dataset you can quickly understand how this works and how to adapt it to your own particular needs.
You may purchase the Power BI Profit and Loss Template for £49 or request a quote to adapt this for your own particular needs. Just fill out the contact us form and we will be in touch.
Alternatively, if you use Sage 50 Accounts, you may purchase the Sage 50 Accounts version of the Power BI Profit and Loss Template for £600 (the template includes all the background transformations for the Sage 50 Accounts dataset) and use the Accounting Insights Sage 50 Accounts Connector to automate updating your report.
The Power Bi Profit and Loss Template comprises four pages:
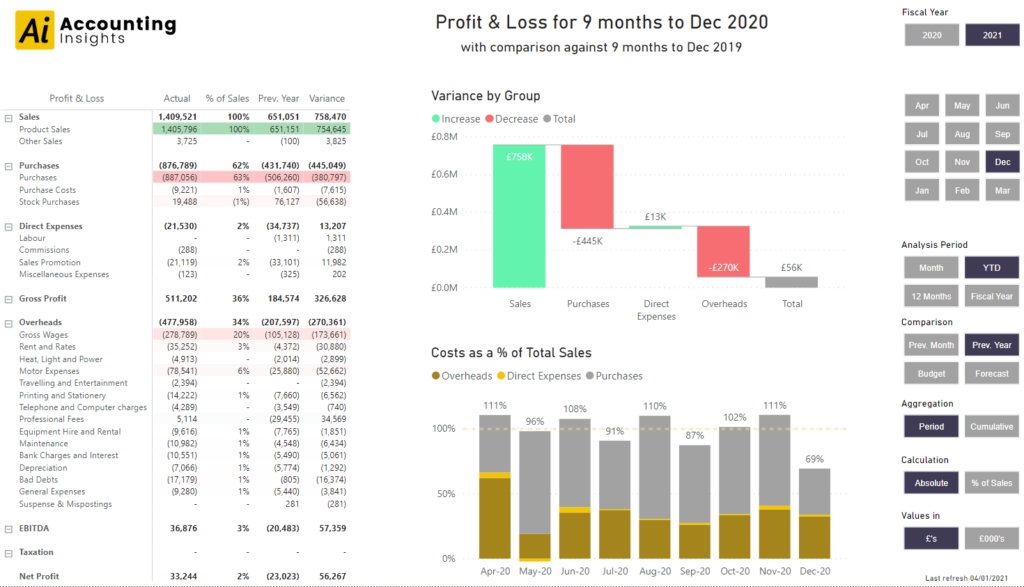
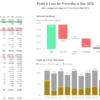
The “P&L Summary” page of the Power BI Profit and Loss Template provides a birds-eye view of your income statement for a selected date range. It shows three key pieces of information:
On the Profit & Loss page there are three main visualisations; a matrix visualisation of the P&L, a waterfall chart to show the variance by nominal group and a stacked column chart showing monthly costs as a % of total sales.
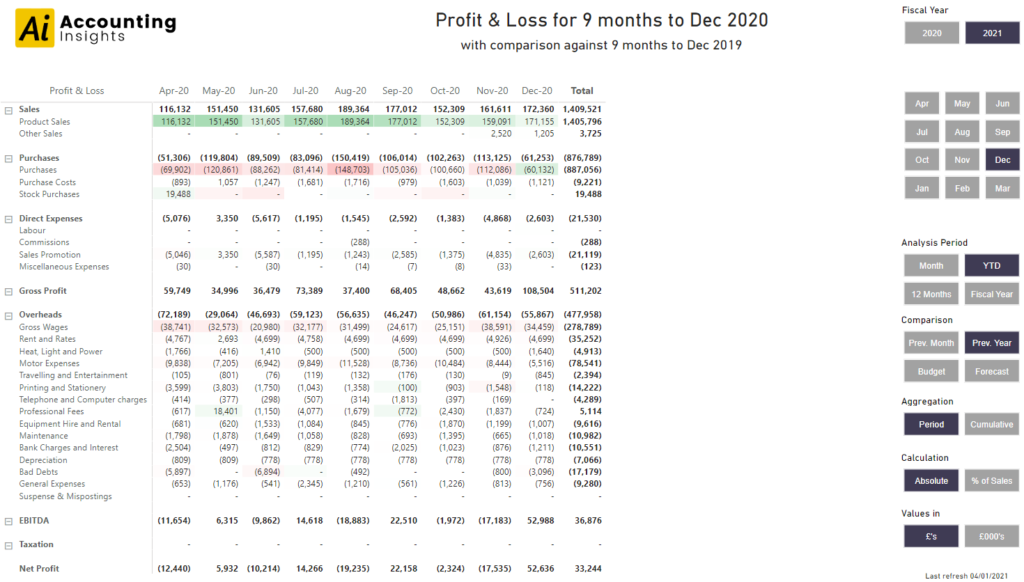
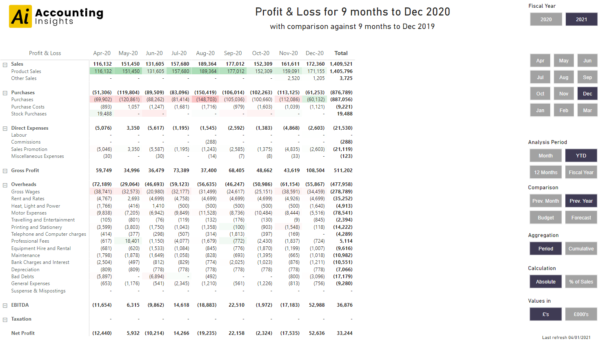
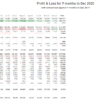
The Monthly P&L page of the Power BI Profit and Loss Template is effectively the same as the Profit & Loss Summary page, but just showing the matrix visualisation with each month of the selected period range as a column in the matrix.
It enables you to see the progression of the income statement month by month. Just like the Profit and Loss Summary page, you can opt to see the figures as absolute numbers or as a % of total sales.
The coloured highlighting reflects the variance against a selected comparison: previous month, previous year, budget or forecast.
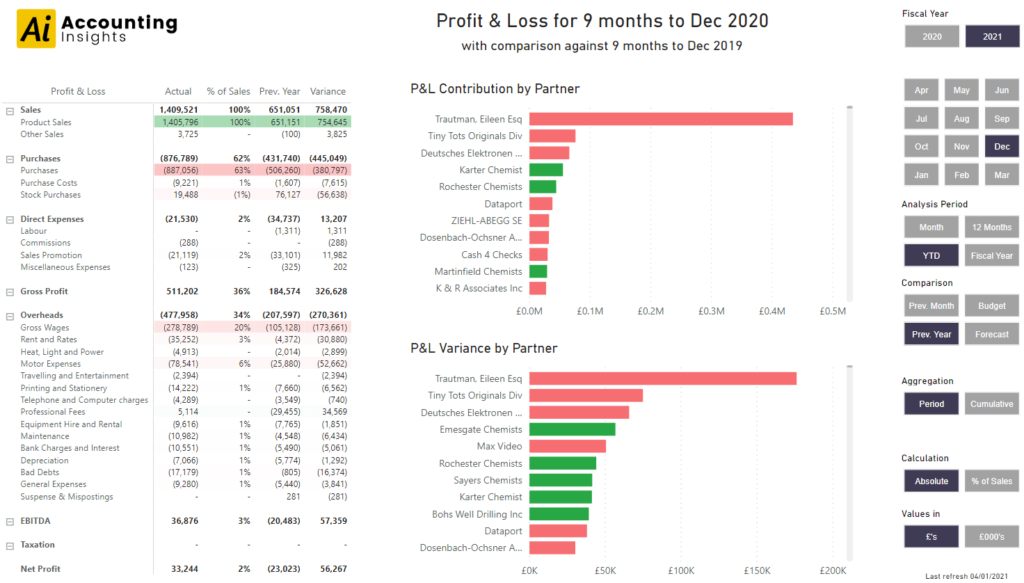
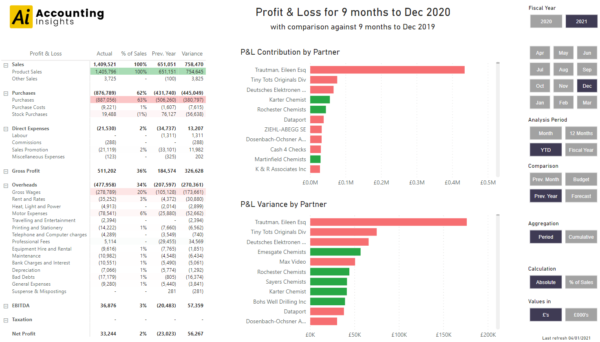
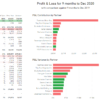
The “P&L Partner Impact” page shows the profit and loss matrix from the P&L Summary page, alongside two bar charts that show the contribution and variance by partner (customer or supplier) for the selected periods.
The purpose of the page is to highlight the most influential trading relationships on the P&L for the selected periods.
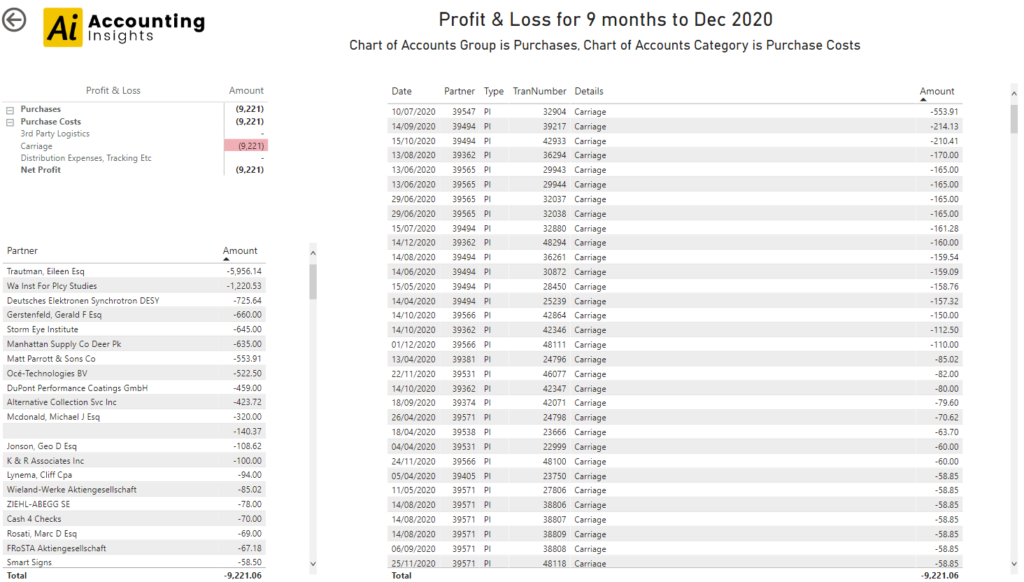
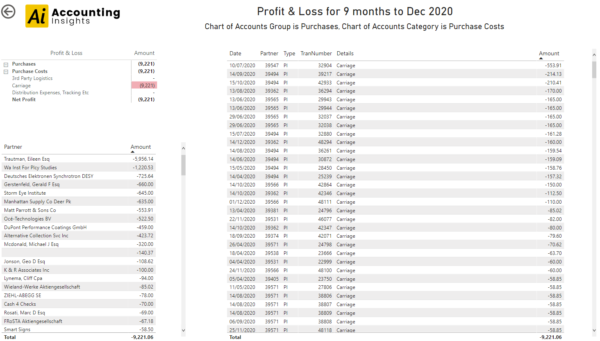
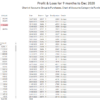
The “P&L Drill Through” page shows every single transaction that makes up a summary total actual figure from any of the other pages in the Power BI Profit & Loss Template. On the left-hand side of the page, there are two visuals, showing summaries from the Chart of Accounts and also by trading partners. These visuals enable you to filter the main transaction listing further.
| Template | PowerBI & Sage50 Accounts |
|---|